CartoWeb is quite a complex piece of software. This chapter is only a quick and consequently incomplete overview of the standard functionalities that are somehow visible for an end-user. The internal architecture and all the hidden features that make CartoWeb customizable and extensible are presented in the next chapter.
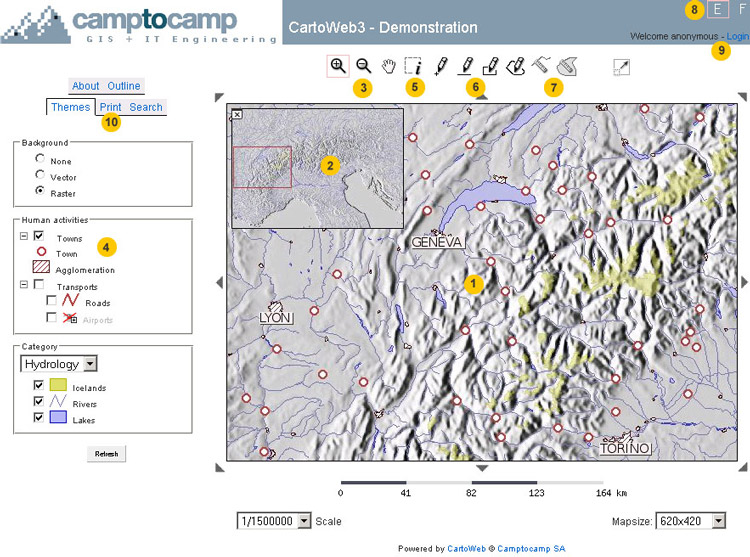
The first figure is an overall view of the user interface of the demo that is shipped with CartoWeb. The numbers refer to more or less visible underlying features. They are :
- Main map
- Dynamic keymap
- Navigation tools : zoom-in, zoo-out, panning
- Layers tree
- Geographic query tool
- Redlining tools : to draw points, lines, rectangles, polygons
- Measuring tools : distances and surfaces
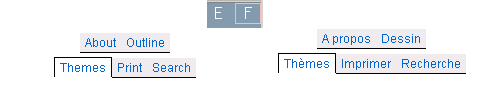
- Language switch : internationalization support
- Login link : users and roles support
- Print dialog : PDF production
There are many possibilities to navigate on the main map, that is to change the scale and the position.
- The arrows surrounding the main map
- The dynamic (i.e. clickable) keymap
- The navigation tools (zoom and pan)
- The drop-down menu "Scale"
- The various options in the "Search" tab
The menu "Mapsize" is self-explanatory.
Contrary to Mapserver itself, CartoWeb supports an arbitrarily complex hierarchy of layers, with infinite depth.
The elements of the layers "tree" have different rendering options :
- normal checkboxes
- blocks
- radio button (exclusive options)
- drop-down menu (exclusive options)
Examples of these rendering options are presented in the following figure.
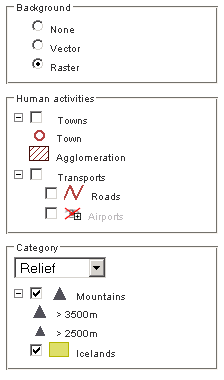
The icons for the classes are automatically drawn, and the out-of-scale layers are grayed out.
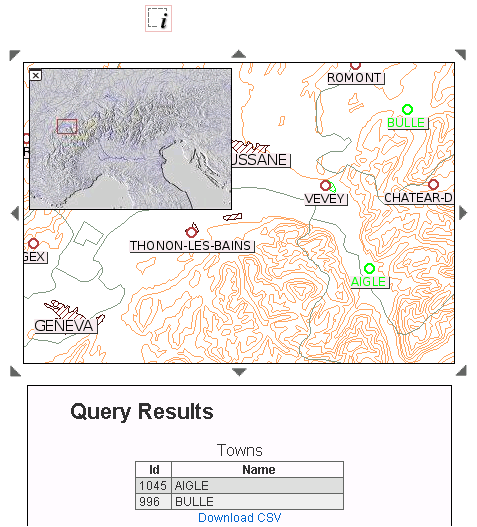
Using the query tool, you can geographically search for objects. Found objects are hilighted and their attributes are displayed.
CartoWeb adds many functionalities to the raw queries supported by Mapserver. In particular, the queries may be persistent (i.e. you can add new objects to already selected objects), and the hilighting can be defined on a layer by layer basis.
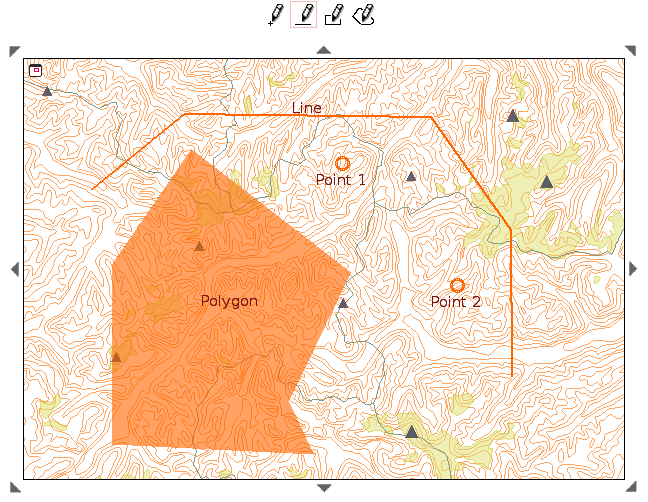
It is possible to freely draw points, lines, rectangles and polygons on the map, ant to attach labels to them. These features are persistent: they survive panning or zooming.
A mask mode, in which everything but the outlined polygon is masked, is provided too.
Distances and surfaces can be measured on the main map with the following tools :

Translation handling in CartoWeb now uses gettext. However internationalization architecture is ready for other translation systems.
Ta make life easier for translators, scripts that gather the strings to be translated in the templates and in the configuration files are available.
Access to different elements of CartoWeb can be allowed or denied according to who is currently using the application. Both functionalities and data may have access restrictions. For instance, PDF printing may be totally unavailable for anonymous access, limited (low resolution) for normal user and totally granted (high resolution) for superusers. Similarly, high-resolution aerial views may only be visible within an organization, while external users should be content with satellite photographs.
A basic (file-based) authentication mechanism is included, but any other mechanism that is able to authenticate an user and to link him to a role could be used as well.
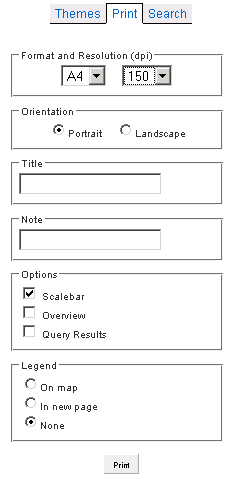
CartoWeb is able to output a fully configurable PDF document. Some options can be chosen by the end user in the following dialog, while the CartoWeb admin defines which elements (maps, legends, tables, additional logos or watermarks...) are to be printed and sets their positions within the page.
Other output formats include the graphic formats (jpeg, png,...) of the map itself, simplified html templates and comma-separated values tables of the query results.